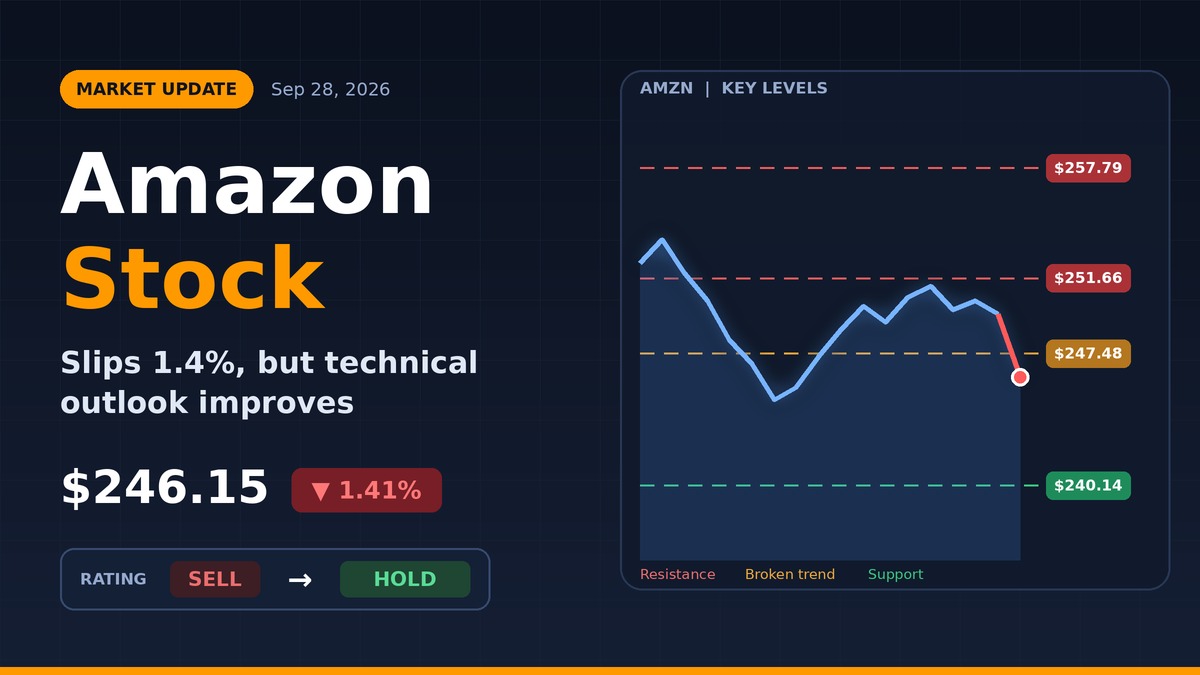
Amazon shares closed lower on Monday, September 28, 2026, falling 1.41% to $246.15 from a prior close of $249.67. The drop added to a choppy two weeks for the retail and cloud giant. Even so, the latest technical review of Amazon stock upgraded its outlook, moving the shares from a Sell candidate to a Hold.
The trading session itself was relatively calm. Shares ranged between a low of $244.73 and a high of $247.77, a spread of $3.04, or 1.24%. About 32 million shares changed hands, worth roughly $7.84 billion, and volume was about 822,000 shares lighter than the previous day.
The mixed picture matters for investors because the signals point in different directions. Moving averages still lean negative, while momentum indicators and a recent pivot low suggest room for recovery. The report concludes that holding or gradually accumulating makes more sense than buying outright until the trend becomes clearer.
Why the outlook was upgraded despite Monday’s decline
The upgrade from Sell to Hold rests on several positive signals that have built up since mid-September. None of them, according to the analysis, is strong enough on its own to make Amazon a buy candidate.
Momentum signals turning positive
A buy signal was generated from a pivot bottom on Wednesday, September 16, 2026. A pivot bottom marks a point where a stock stopped falling and began to turn higher. The gain since then has been minimal, just 0.0772%, but the analysis indicates further upside until a new top pivot forms.
The three-month Moving Average Convergence Divergence (MACD) indicator has also issued a buy signal. MACD tracks the gap between short-term and longer-term averages to measure whether momentum is strengthening or fading.
Falling volume on a down day
Volume dropped along with the price on Monday. In technical analysis, that pattern is generally read as a sign of lower risk, since it suggests the selling was not driven by heavy, broad-based pressure. Volume that follows the direction of price is considered healthier than volume that surges against it.
The warning signs still on the chart
Several indicators continue to argue for caution, which is why the rating stopped at Hold.
A broken short-term trend
Amazon stock has fallen below the lower edge of a wide, weak rising short-term trend. The report describes this as a signal that the pace of gains is slowing and a possible early warning of a trend change. With that trend line broken, its former floor near $247.48 now becomes a resistance level. The analysis notes that a bounce back to this area could give holders a second chance to exit before any further decline.
Moving averages flash sell signals
Both short-term and long-term moving averages currently carry sell signals. There is also a general sell signal from the relationship between the two, since the long-term average sits above the short-term average. That configuration typically reflects weakening recent performance compared with the longer trend.
How moving average crossovers work
Moving averages smooth out daily price swings by averaging closing prices over a set period. When a short-term average drops below a long-term one, traders often read it as a bearish shift. When it climbs back above, that reverses into a bullish signal. These signals lag actual price action, which is why analysts pair them with momentum tools like MACD.
Key price levels to watch
The report identifies several levels that could shape Amazon’s next move.
| Level | Price | Role |
|---|---|---|
| Upper resistance | $257.79 | Moving average resistance; a break above would trigger a buy signal |
| Near resistance | $251.66 | Moving average resistance; a break above would trigger a buy signal |
| Broken trend line | $247.48 | New resistance after the short-term trend was breached |
| Monday close | $246.15 | Current reference price |
| Volume support | $240.14 | Support from accumulated trading volume |
Support at $240.14 comes from accumulated volume, meaning a large number of shares previously traded near that price. The analysis suggests a test of this level may present a buying opportunity, as stocks often react upward when such support holds.
Volatility and risk profile
Amazon is described as a stock with very controlled price movements and strong liquidity, and its overall risk is rated as very low. Average daily volatility over the past week was 1.86%, slightly higher than Monday’s 1.24% range. Over the past two weeks, the stock has lost 2.91%.
Analyst sentiment
On September 3, 2026, Wells Fargo was reported to have maintained its Overweight rating on Amazon (ticker AMZN). An Overweight rating generally signals that an analyst expects a stock to outperform its sector or the broader market over time, which offers a longer-term view that contrasts with the short-term technical caution.
What comes next for Amazon stock
For now, the technical case sits in the middle. A move above $251.66 or $257.79 would generate fresh buy signals and could support a further upgrade. A slide toward $240.14 would test the volume support that the analysis views as a potential entry point. Until one of those scenarios plays out, the report’s position is to hold or accumulate while waiting for further developments.
Disclaimer: This content was partially produced with the help of AI tools and This content is for informational purposes only and not investment advice.