Tesla is scheduled to report its third-quarter vehicle deliveries on Oct. 2, and the release is one of the few hard data points investors get before the company’s full earnings report. Because deliveries are effectively Tesla’s unit sales, analysts can feed the figure directly into their revenue models, which is why Tesla stock often reacts sharply on the day.
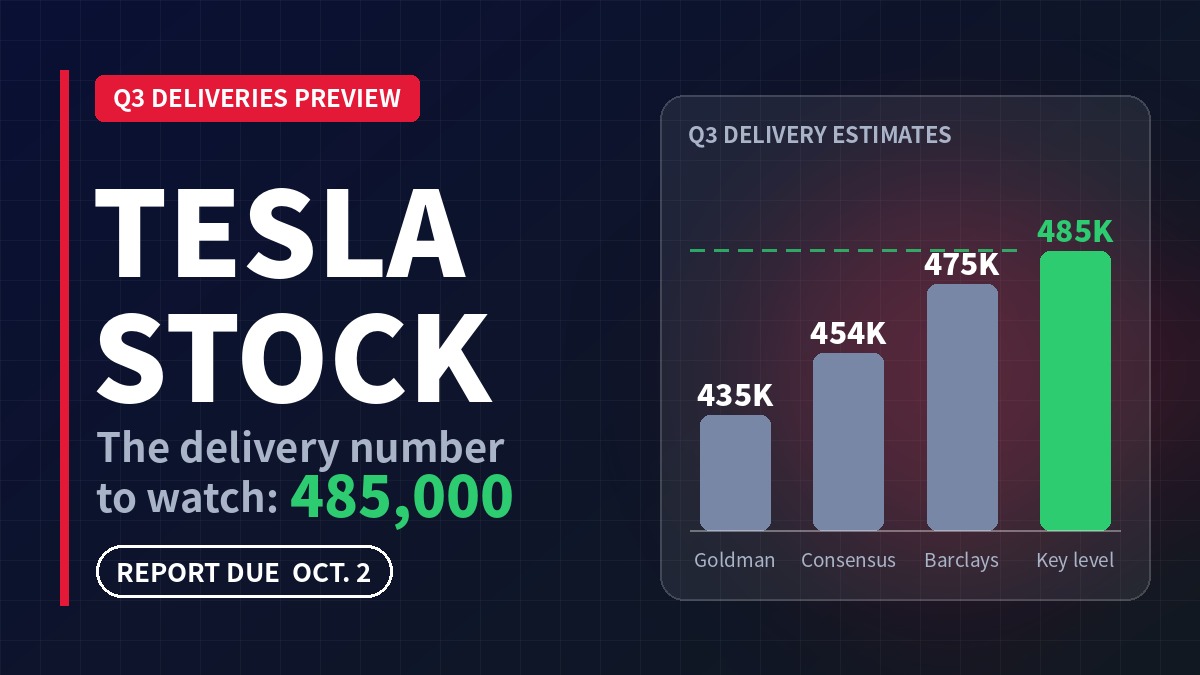
Expectations are far from settled. The Wall Street consensus compiled by Visible Alpha calls for about 454,000 deliveries, but individual forecasts span a 40,000-vehicle range: a Goldman Sachs analyst recently projected 435,000, while a Barclays analyst put the figure at 475,000.
Beating the consensus may not be enough to tell the full story, though. One market analysis argues the more revealing measure is whether Tesla can keep increasing production without letting unsold cars accumulate, and it identifies roughly 485,000 deliveries as the level that would signal both.
What Wall Street Expects From Tesla’s Q3 Report
The estimates below come from the figures cited in the original analysis.
| Metric | Figure | Source |
|---|---|---|
| Q3 delivery consensus | 454,000 | Visible Alpha |
| Low-end delivery forecast | 435,000 | Goldman Sachs analyst |
| High-end delivery forecast | 475,000 | Barclays analyst |
| Q3 production consensus | 487,000 | Wall Street consensus |
| Q2 actual deliveries | 480,126 | Tesla |
The consensus implies a step back from Q2
The consensus figure sits about 26,000 vehicles, or roughly 5%, below what Tesla delivered in the second quarter. Even the Barclays estimate, at the top of the range, is below the Q2 total. That context matters: Q2 was a strong quarter for volume, but according to the analysis, it came with margin pressure, partly from the cost of incentives Tesla used to drive sales.
Why Inventory Days Could Move Tesla Stock
Tesla tracks global vehicle inventory in terms of days of supply, meaning how many days of sales its unsold stock would cover. A high reading suggests cars are sitting on lots, which ties up cash in assets that aren’t producing a return. A low reading generally points to healthier demand relative to output.
What changed in the second quarter
Tesla brought its inventory measure down to 15 days in Q2. The analysis attributes much of that improvement to the quarter’s strong sales, with the caveat that incentives helped produce those sales and weighed on profitability.
How the 485,000 Threshold Is Calculated
The analysis starts from two assumptions: Tesla produces the consensus 487,000 vehicles in Q3, and inventory holds steady at 15 days. From there, the math works in three steps.
First, it estimates end-of-Q2 inventory at about 96,025 vehicles, calculated as 480,126 deliveries multiplied by 15 and divided by 75. Second, it adds that inventory to projected Q3 production, giving roughly 583,000 vehicles available to sell. Third, it solves for the delivery number that leaves inventory at 15 days, which produces about 485,833 deliveries, with around 97,000 vehicles remaining in stock.
Does the result hold under different assumptions?
The original calculation uses a 75-day divisor rather than the full length of a calendar quarter. Rerunning the same logic with a 91-day Q2 and a 92-day Q3 lowers the starting inventory estimate to about 79,000 vehicles, but the delivery threshold barely moves, landing near 486,800. In other words, the roughly 485,000 figure is not especially sensitive to that choice.
What the threshold does and does not capture
A delivery figure above that level, paired with production near consensus, would suggest Tesla is growing output while keeping inventory in check. The author of the analysis views a result above 485,000 as one that could lift the stock. It would not, however, say anything about pricing or margins. If incentives drove the volume, as the analysis suggests happened in Q2, the profitability picture will only become clear when Tesla reports full quarterly results.
What to Watch on Oct. 2
Tesla’s quarterly release typically reports both production and deliveries, so investors can test the inventory question directly rather than relying on the delivery number alone. Three comparisons will frame the reaction: deliveries against the 454,000 consensus, deliveries against the roughly 485,000 inventory-neutral level, and production against the 487,000 estimate. A gap between production and deliveries in either direction will offer the first signal of whether inventory rose or fell during the quarter.
Disclaimer: This content was partially produced with the help of AI tools and This content is for informational purposes only and not investment advice.