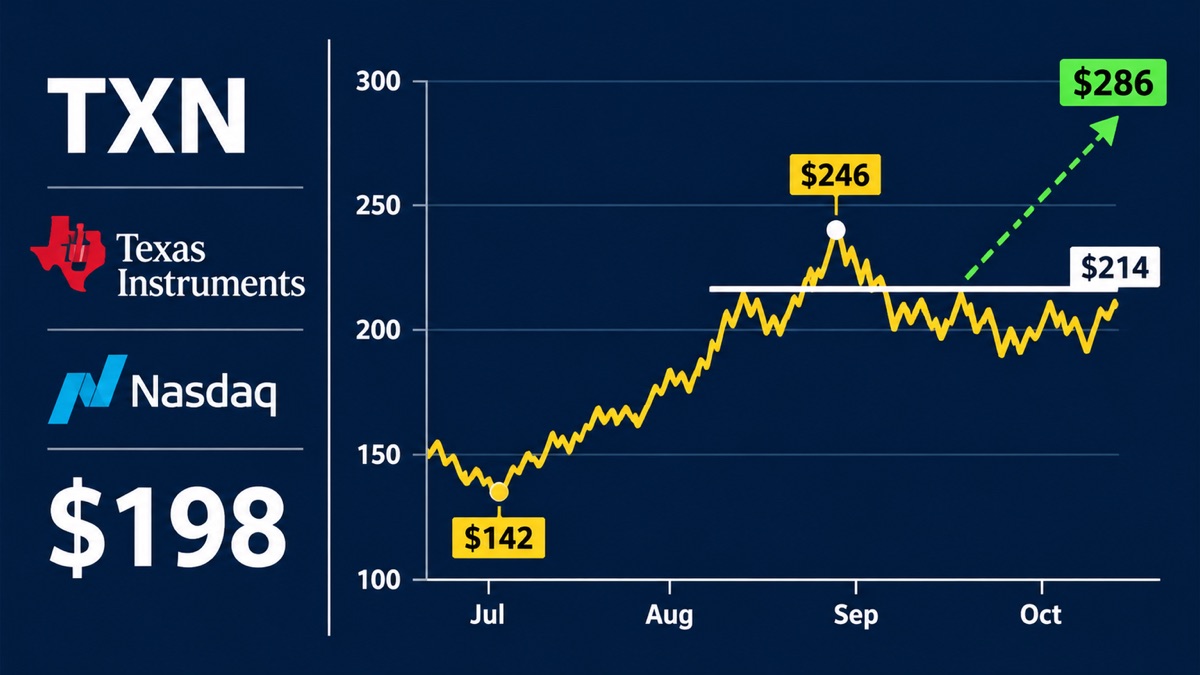
Texas Instruments stock has spent the past several weeks stuck in a narrowing range, trading near $198 after failing to clear this month’s high of $214. The pause comes after a climb off the summer low, and it now sets up a clear test: whether buyers can push the shares through a ceiling they have already met.
Shares sit about 8.1% below that monthly high but roughly 39% above the July low of $142, a level reached before the run to $246. That round trip, a drop of about 42% from the high followed by a series of higher lows, is why the band is being watched so closely.
What happens next likely depends on two things: the company’s upcoming report, where revenue is projected to rise about 18% from a year earlier, and whether the chart pattern formed in the consolidation resolves upward or breaks down.
Where the shares stand now
Texas Instruments trades on Nasdaq under the ticker TXN. The business under the chart is analog and embedded chips sold into factories, cars, and industrial gear. The table below shows the key price levels in this read, measured from $198.
| Level | Price | Distance from $198 |
|---|---|---|
| Recent high | $246 | +24.2% |
| Recent resistance (this month’s high) | $214 | +8.1% |
| Current price | $198 | n/a |
| July low | $142 | -28.3% |
The ascending triangle setup
Since the July bottom, the stock has made higher lows while stalling near $214. Readers of charts call that an ascending triangle: a flat ceiling and a rising floor. Buyers have paid up from the low. Sellers have held the same line.
A common target takes the height of the pattern and adds it to resistance. The distance from $142 to $214 is $72, which points to about $286. A move through the $246 high would show the range has given way, rather than another stop at the same shelf.
Why chart patterns are not guarantees
The drawing can fail. If the rising line breaks, $142 is a price the market has already traded, and $286 stops being the working target. A pattern records where orders clustered. It does not force the next order.
The business case under the chart
Texas Instruments makes the analog parts that turn heat, pressure, and current into signals a machine can use. Those chips sit in factory controls, vehicle electronics, and power systems, so a slower factory year shows up in orders before it shows up in a slogan.
What analysts expect
The working figure for the next report is revenue about 18% higher than a year earlier. That is a rebound read, not a promise. If shipments into industrial customers stay soft, the percentage can come in lower even while the chart still looks tidy.
Orders and the backlog
Analog orders tend to stretch across quarters. A fuller book from auto and factory customers would support the idea that $214 is a pause. A thinner book would fit a slide back toward prices the stock has already printed.
Valuation
At $198, the shares are still well above the July low and still short of both $214 and the $246 high. The $286 figure is only the height of the current pattern added to resistance. It stands if buyers clear $214. It comes off the page if they do not.