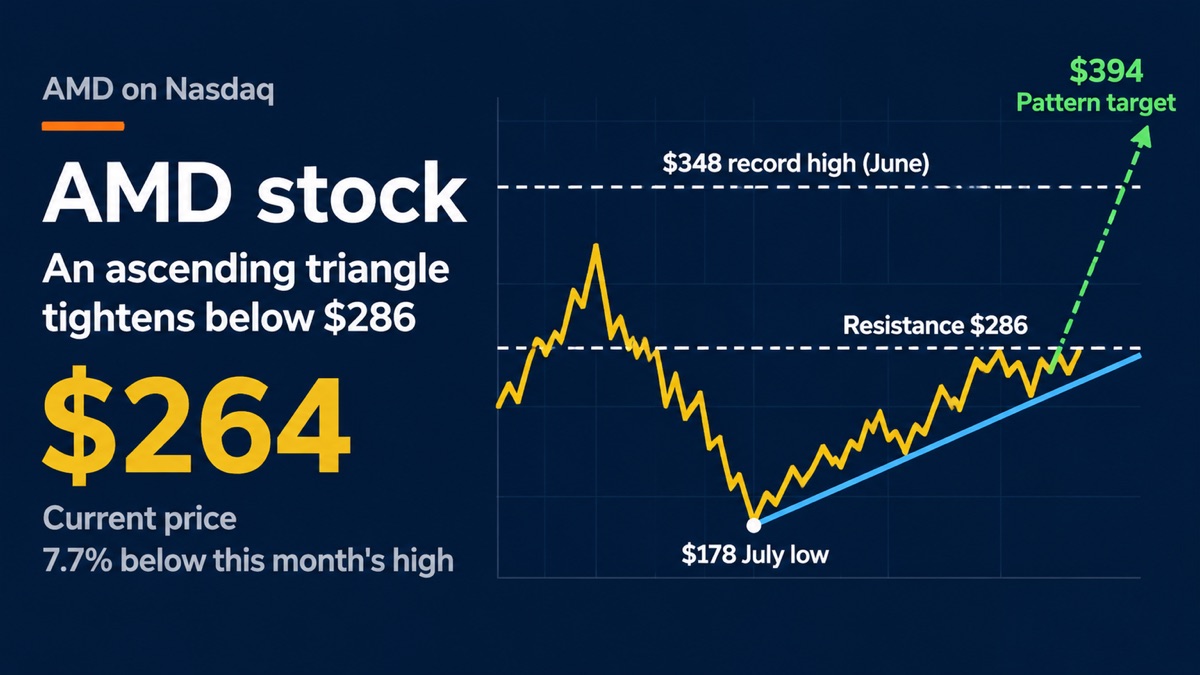
AMD stock has spent the past several weeks stuck in a narrowing range, trading near $264 after failing to clear this month’s high of $286. The pause comes after a steady climb off the summer low, and it now sets up a clear test: whether buyers can push the shares through a ceiling they have already met more than once.
The numbers behind the stall are easy to read. Shares sit about 7.7% below that monthly high but roughly 48% above the July low of $178, a level reached after a fall from June’s record of $348. That round trip, a drop of nearly 49% followed by a climb that kept making higher lows, is why traders are watching the current range so closely.
What happens next likely depends on two things: the company’s upcoming report, where data-center revenue is projected to rise about 41% from a year earlier, and whether the chart pattern that has formed during the consolidation resolves upward or breaks down.
Where the shares stand now
AMD trades on Nasdaq under the ticker AMD and has become one of the more closely watched names in the accelerator trade. The table below shows the key price levels in this read, measured from the current price of $264.
| Level | Price | Distance from $264 |
|---|---|---|
| All-time high (June) | $348 | +31.8% |
| Recent resistance (this month’s high) | $286 | +8.3% |
| Current price | $264 | n/a |
| July low | $178 | -32.6% |
The ascending triangle setup
Since the July bottom, the stock has made a series of higher lows while repeatedly stalling near $286. Technical readers call this shape an ascending triangle: a flat upper boundary paired with a rising lower trendline. The pattern is often read as constructive, because it suggests buyers are stepping in at progressively higher prices while sellers hold a fixed line.
A common way to estimate a breakout target is to measure the triangle’s height and add it to the resistance level. Here, the distance between $178 and $286 is $108, which points to a potential target near $394. A move above the $348 record would serve as confirmation that the range has actually given way, rather than another failure at the same ceiling.
Why chart patterns are not guarantees
An ascending triangle can fail. If the rising trendline breaks, the same height that points to $394 can be read in the other direction, and the July low of $178 comes back into view as a level the market already knows. The pattern describes where traders have been willing to buy and sell. It does not force the next print.
The business case behind the rally
The chart is only half the story. AMD’s data-center business is the piece the range is waiting on. Accelerators and server processors have been taking a larger share of sales, and the next report is expected to show data-center revenue up about 41% from the year-ago quarter. That is a large step for a business that already runs at a high base, which is why the tape has stopped falling without being allowed to break out.
The rest of the company is quieter. Client processors and the game-console cycle are not what this range is pricing. If data-center growth lands near that 41% mark and the outlook holds a similar pace, the ceiling at $286 has a fundamental reason to give way. If the number misses, the higher lows lose the story that has been supporting them.
What analysts expect next
The current read is straightforward. Data-center revenue is projected to rise about 41% year over year, with the gain tied to accelerator shipments and a fuller server lineup. Gross margin is expected to hold if the mix stays tilted toward those higher-priced parts. The figure that will matter in the first hour is not a rounded earnings headline. It is whether data-center revenue clears the bar this range has already been leaning on.
Orders that keep the book visible
Cloud buyers have been signing longer supply arrangements for accelerators, which gives the next few quarters more visibility than a pure spot cycle. Those arrangements do not remove competition, and they do not set the share price. They do mean a soft quarter is harder to dismiss as a one-week air pocket. That is the backdrop for a stock that has stopped falling and has not been allowed through $286.
Valuation and the levels that matter
At $264, AMD is still about 24% under the June record of $348. The shares are not priced as if the data-center line has already delivered the 41% step, and they are not back at the summer distress low either. The range between $178 and $286 is the market’s way of waiting for that number.
A close above $286 would put the record high back on the table and, on the triangle math, open a path toward $394. A close back under the rising trendline would say the buyers who defended each higher low have stepped away. Until one of those two things happens, the stock is doing what this kind of pattern does: tightening, and waiting.