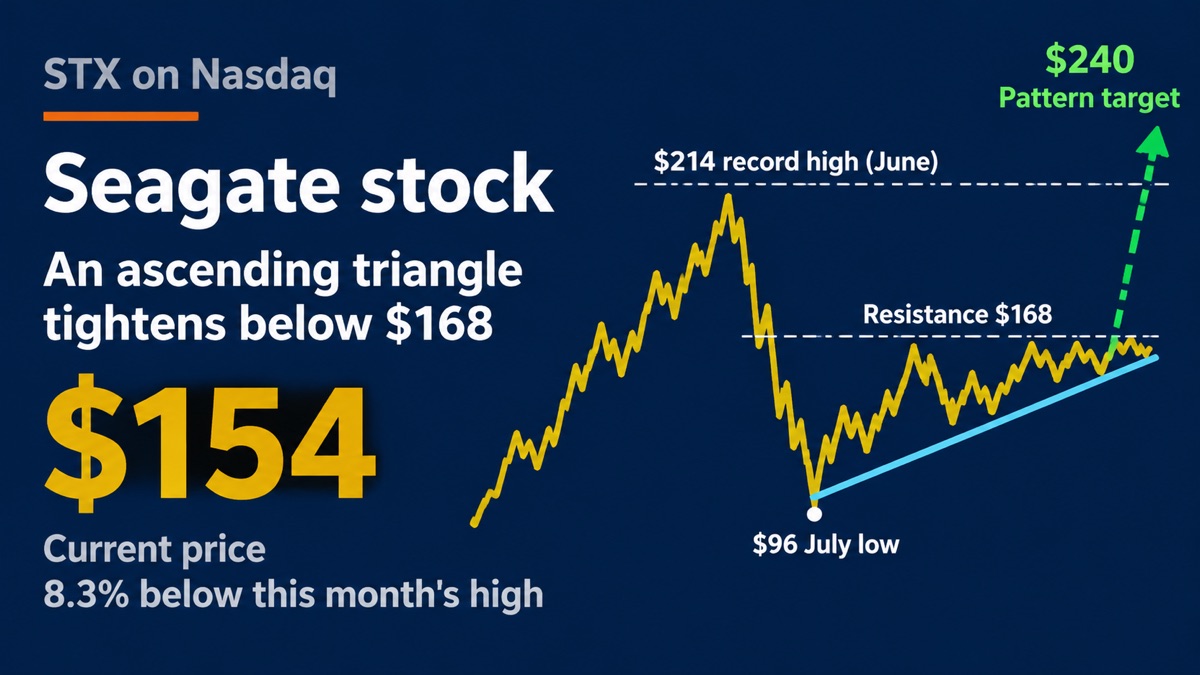
Seagate stock has spent the past several weeks stuck in a narrowing range, trading near $154 after failing to clear this month’s high of $168. The pause comes after a sharp recovery in nearline drive demand, and it now sets up a clear test: whether buyers can push the shares through a ceiling they have tested and left behind.
The distances are large enough to matter. Shares sit about 8.3% below that monthly high but roughly 60% above the July low of $96, a level reached after a fall from June’s record of $214. That round trip, a drop of about 55% followed by a climb of higher lows, explains why the current band is being treated as a decision point rather than a drift.
What happens next likely depends on two things: the company’s upcoming report, where revenue is projected to rise about 28% from a year earlier, and whether the chart pattern that has formed during the consolidation resolves upward or breaks down.
Where the shares stand now
Seagate trades on Nasdaq under the ticker STX. The business the tape is watching is nearline hard-disk capacity sold into cloud data centers, not the older client-drive cycle. The table below shows the key price levels in this read, measured from the current price of $154.
| Level | Price | Distance from $154 |
|---|---|---|
| All-time high (June) | $214 | +39.0% |
| Recent resistance (this month’s high) | $168 | +9.1% |
| Current price | $154 | n/a |
| July low | $96 | -37.7% |
The ascending triangle setup
Since the July bottom, the stock has made a series of higher lows while repeatedly stalling near $168. Technical readers call this shape an ascending triangle: a flat upper boundary paired with a rising lower trendline. Buyers have been willing to pay up from the low. Sellers have kept the same line.
A common way to estimate a breakout target is to measure the triangle’s height and add it to the resistance level. Here, the distance between $96 and $168 is $72, which points to a potential target near $240. A move above the $214 record would show that the range has given way, rather than another rejection at the same shelf.
Why chart patterns are not guarantees
The same drawing can fail. If the rising trendline gives way, the July low of $96 is the level the market has already traded, and the $240 figure stops being the working target. A pattern is a record of where orders have clustered. It is not a promise that the next order arrives on the same side.
The business case behind the rally
Cloud operators have been adding nearline hard-disk capacity again, because a large share of stored data still lives on spinning drives even as flash takes the hot tier. That shift is the fundamental story sitting under the chart. The next report is expected to show revenue up about 28% from the year-ago quarter, a rebound from the trough rather than a new line of business.
The risk is the same one storage investors already know. Drive pricing and exabyte shipments can cool if cloud buyers pause builds. A 28% revenue step that arrives with weaker shipment guidance would leave the stock inside the range. A 28% step that arrives with a fuller second-half build would give the $168 ceiling a reason to break.
What analysts expect next
The working estimate is a revenue increase of about 28% year over year, led by nearline exabytes rather than client units. Gross margin is expected to improve if the mix stays weighted to those higher-capacity drives. The first number that will move the range is revenue against that 28% bar, and the second is whether management talks about builds extending past this quarter.
Contracts that smooth the drive cycle
Several large cloud buyers have moved from spot orders to build schedules that run across more than one quarter. That does not lock the share price, and it does not stop a customer from slipping a rack. It does make the next report less of a coin flip than the trough quarters were. The chart’s higher lows line up with that change in visibility.
Valuation and the levels that matter
At $154, Seagate is still about 28% under the June record of $214. The shares have already recovered the panic low, and they have not been allowed to price in a clean break of the build cycle. The band between $96 and $168 is the wait.
A close above $168 would put the old high back in range and, on the triangle math, open a path toward $240. A close under the rising trendline would say the recovery has stalled. Until one of those prints arrives, the stock stays where patterns like this usually sit: tight, just under the line it has not crossed.